|
Help Files:
|
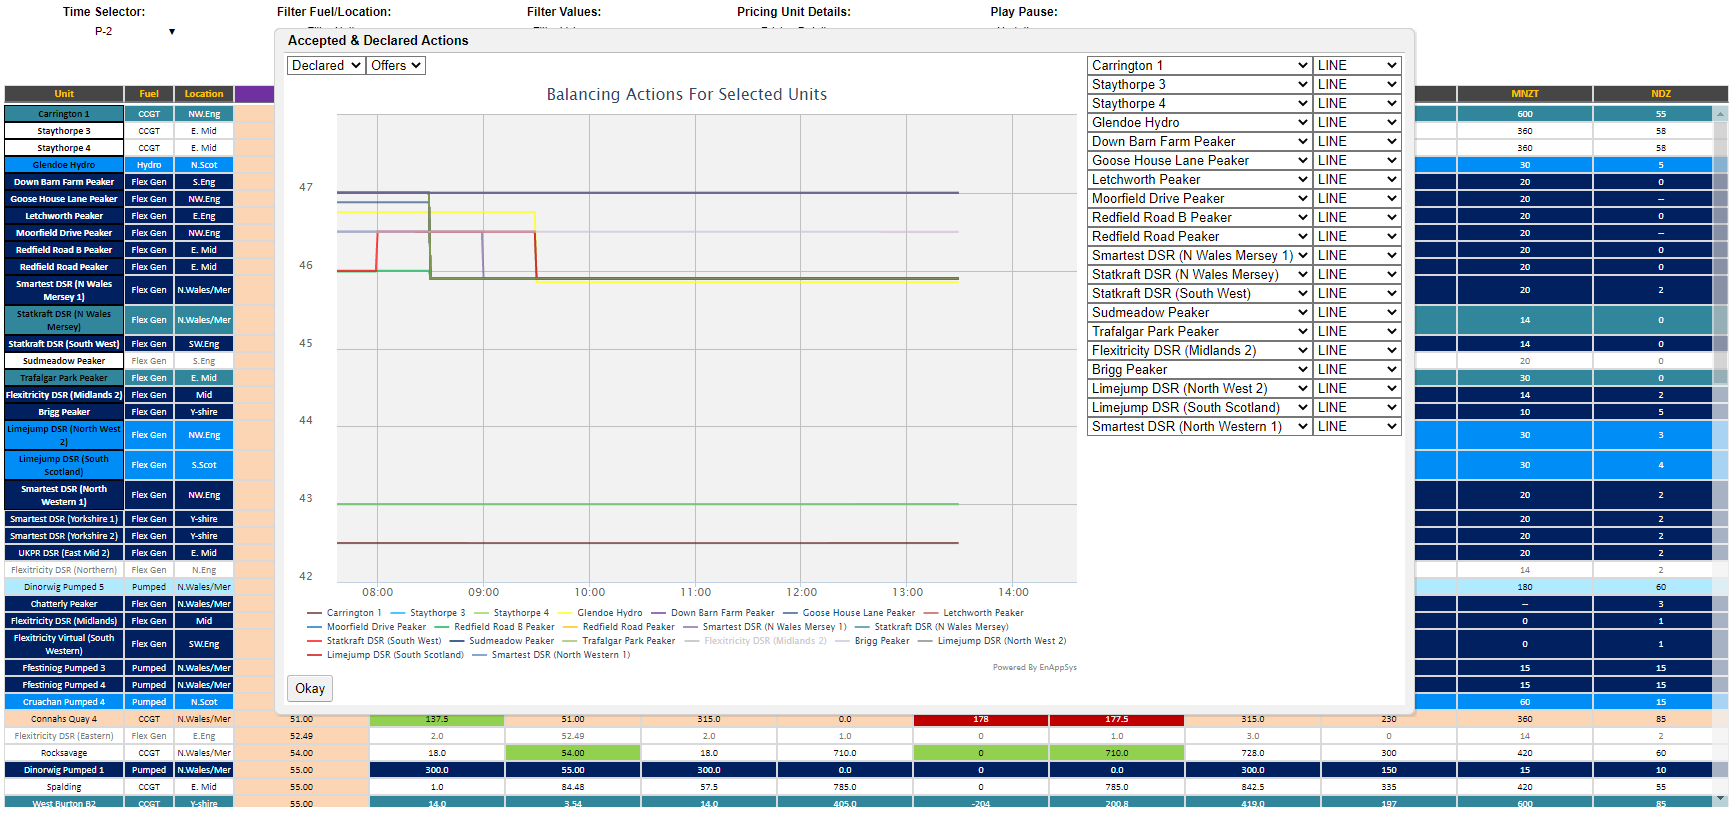
Offer TableAboutThe Offer Table screen offers a stack showing the volumes and prices for the next declared offer pair. Alongside this a variety of supporting data streams are available including the total declared prices and volumes (capped at MEL) and generation and dynamic data. To see more information about a particular unit the user can click on the unit name and this will give an option of viewing the 'Bid/Offer Profile' chart (which will show the units prices and volumes at which it will increase or decrease output) or the 'BM Unit Operations' chart (which shows what the unit has been doing and what it plans to do in the market). This chart is designed as a stack of the units most likely to see offers accepted from a price perspective. Row colour also shows bids (turquoise), offers (orange), offline units (light blue), offline units with a fast response time (blue) and offline units with both a fast response time and a short minimum generation time (dark blue). These blue and dark blue units are expected to carry a premium in the market. Further colouring shows where units have seen a significant change in values from 30 minutes ago this is particularly useful for seeing when units are starting up or going offline. Note that when a unit is being bid down the price currently shown is the first offer price not the undo bid price although this may be corrected at a later date if requested. Note that moving left and right when target time has been chosen by period will move from one settlement period to the next. This will take the average values across the settlement period. Within the settlement period levels of generation will change minute-to-minute and so LIVE and Custom Time allow for the selection of either the current position or the position at a particular time. On this chart it is possible to examine the information at the accepted/declared bids/offers at a selected group of units. By default the first 20 units on the table will be selected. Then information about these units can be seen for those selected by using 'Pricing Unit Details' > 'See Declared Offers...'. The selected units can be changed by clicking on the cell containing the unit name without click on the link on the name itself.
Included DataThe data on this chart is as follows:
Colours GuideThe following details the colours used in this chart:
Data ServiceThe data for the Offer Table can be extracted from the API. The parameters are as follows:
|
||||||||||||||||||||||||||||||||||||||||||||
