|
Help Files:
|
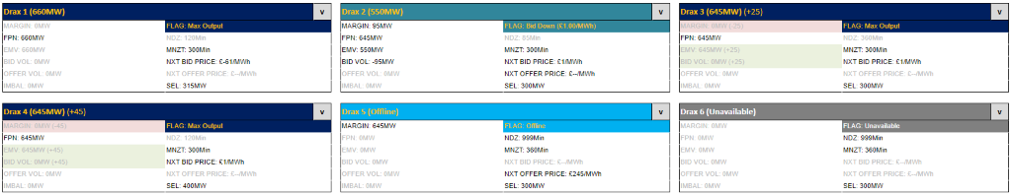
BM Unit InfoAboutThe BM Unit Info screen allows the user to choose 15 units (via "v" in the right corner of each box) that can be tracked via summary information boxes which will keep the user informed about key activity noted at those units. This is useful for providing information of the current status of these plants, for instance to show if plants are currently being turned up or down or whether they are suffering from a plant trip. If you click on the Unit name it forwards you to the detailed "BM Unit Operation" chart. To make it easier to visually understand the activity at these units the boxes are colour coded. The units will be given a flag with its own colour reference (for instance units at maximum output are given the flag Max Output). Additionally, the colours green and red indicate when a parameter is increasing or decreasing with a colour scale to highlight the size of this change. Beyond this the boxes will have data entries with changes included in these cells when they occur and with values greyed out when not of primary interest (for instance a unit at max output will have its MARGIN greyed out). This makes key values more immediately obvious. The Balancing Summary chart shows summary prices at the top of the table including the NIV and system price forecast for the chosen time period. Below this sits the offer and bid stacks, with accepted actions at the top and then the non-accepted actions below ranked by price, but split into two separate stacks.
For example, Drax 5 is offline which is indicated with a light blue colour. Data ServiceThere is no data service for this chart. |
|