|
Help Files:
|
Balancing Summary
About
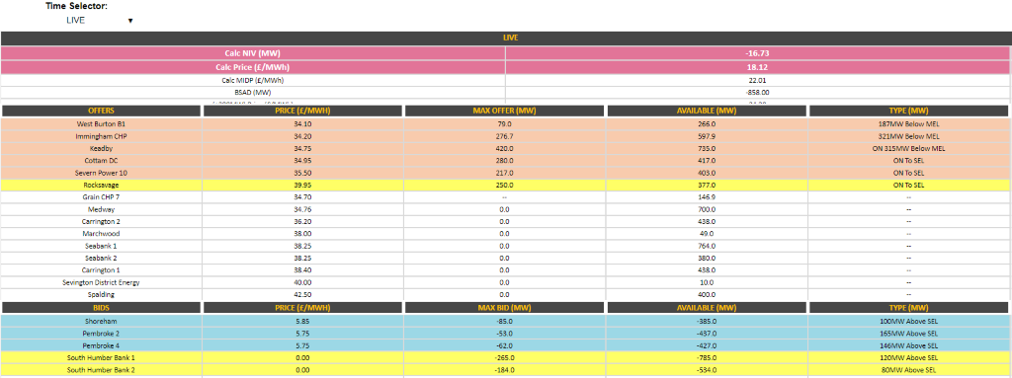
The Balancing Summary chart shows summary prices at the top of the table including the NIV and system price forecast for the chosen time period. Below this sits the offer and bid stacks, with accepted actions at the top and then the non-accepted actions below ranked by price, but split into two separate stacks.
Included Data
The data on this chart is as follows:
- Calc NIV - The current calculated NIV position based upon already accepted actions for the period.
- Calc Price - The current calculated System Price based upon already accepted actions for the period.
- Calc MIDP - The current calculated MIDP based upon accepted trades in the EPEX intraday markets.
- BSAD - The currently declared levels of BSAD activity
- Price - Price at which actions have been accepted or the next valid declared price in the Balancing Mechanism.
- Max Bid/Max Offer - The biggest recorded bid/offer volume, with this being a max in order to allow the identification of units that are only partially running in the period at max output.
- Available - T The availability or Max Export Limit in MW.
- Type - A rough classification of any accepted actions to provide more information on where they might be turned off, brought ON from zero (to SEL/MEL/Below MEL), or bid down to SEL or above SEL.
Colours Guide
The following details the colours used in this chart:
| Styling |
Description |
|
Price Prediction |
|
Accepted Offer (Energy Action) |
|
Accepted Bid (Energy Action) |
|
System Action (BSAD/Offer/Bid) |
Data Service
There is no data service for this chart.
|