|
Help Files:
|
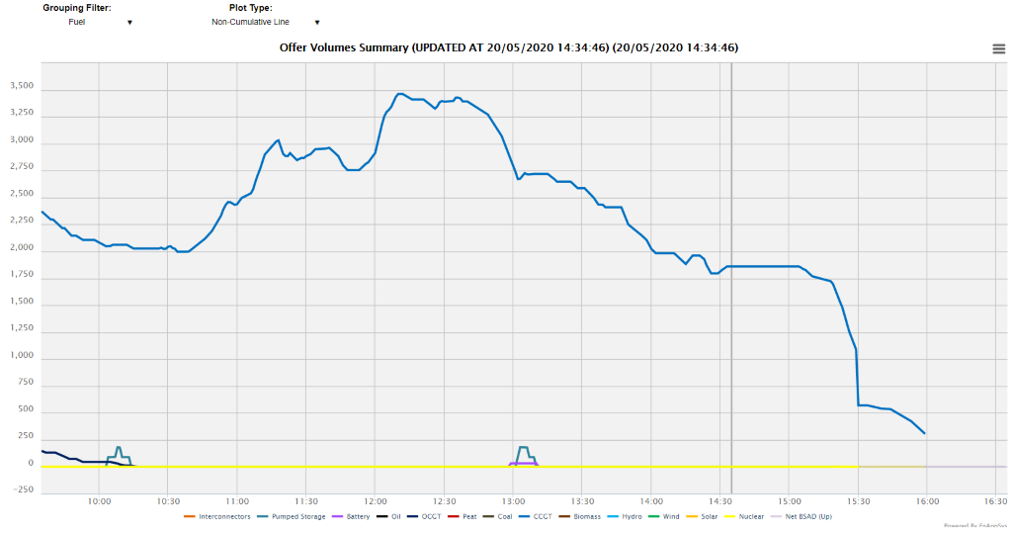
Offer Volume SummaryAboutThe Offer Volume Summary chart shows levels of offer volumes by fuel type or by offer price. This shows which types of units are being offered up in the market. The data can be grouped by “Price” or “Fuel” and be shown as a “Cumulative Area” or as a “Non-Cumulative Line”. Clicking on the chart will open a box showing which units are being offered up the given time ranked by price. Once this box is opened it is possible to click through from here to see the unit's charts.
This example shows that mainly high volumes of CCGT are offered combined with occasional offers of pumped storage, battery and OCGT. Included DataThe data on this chart is the Accepted Offer Volume data, which represents the volume of actions taken by National Grid to increase generation via the Balancing Mechanism within gate-closure. Additionally the upward BSAD volumes are shown which show the volume of activity taken outside the Balancing Mechanism (typically via interconnectors). Data ServiceThe data for the Offer Volumes Summary chart can be extracted from the API. The parameters are as follows:
|
||||||||||||||||||||||