|
Help Files:
|
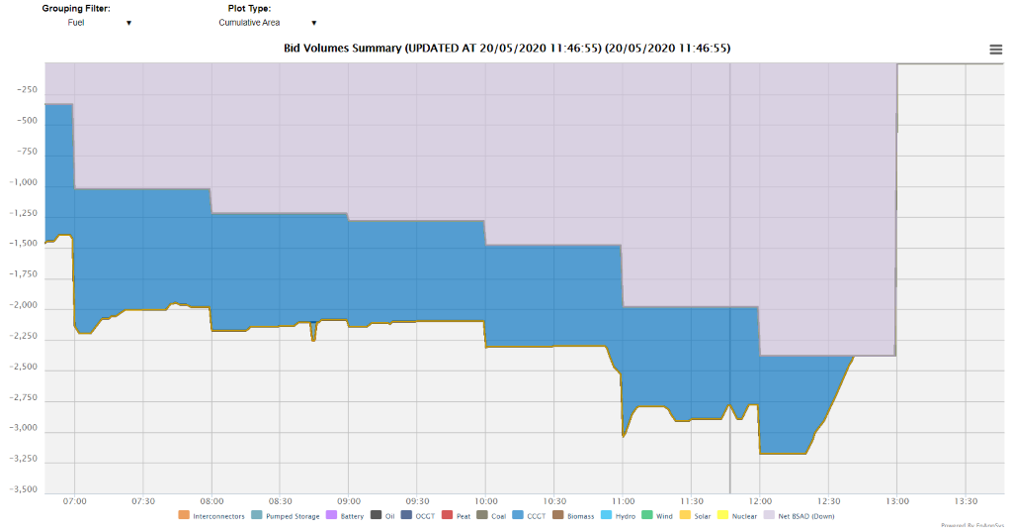
Bid Volume SummaryAboutThe Bid Volumes Summary chart shows the total accepted bid volumes (to reduce generation) in the market via the Balancing Mechanism, either grouped by fuel or by price. This chart can be clicked upon to see the units for any given minute and then it is possible to click through for any of these units to find out more about the underlying action.
The graph above shows, that most bid volumes came from Net BSAD (Down), that are for balancing actions taken outside of the Balancing Mechanism, and CCGT. Included DataThe data on this chart is the Accepted Bid Volume data, which represents the volume of actions taken by National Grid to reduce generation via the Balancing Mechanism within gate-closure. Additionally the downward BSAD volumes are shown which show the volume of activity taken outside the Balancing Mechanism (typically via interconnectors). Data ServiceThe data for the Bid Volumes Summary chart can be extracted from the API. The parameters are as follows:
|
||||||||||||||||||||||