|
Help Files:
|
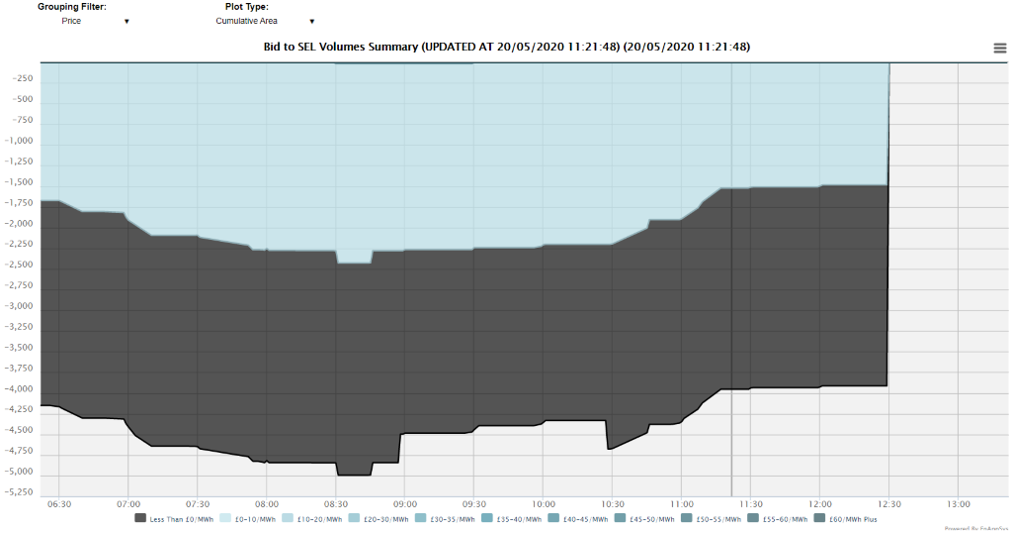
Bid to SEL Volume SummaryAboutThe Bid to SEL Volumes Summary chart was created in order to show on a windy night what the cost to the system would be to turn conventional plants down to their minimum Stable Export Limits (SELs). The chart can either be grouped by "Price" or by "Fuel". The data can be plotted as a "Cumulative Area" or as a "Non-Cumulative Line". Where the system has negative prices being accepted for locational (system) reasons, they do not affect the system price, but this is no longer the case when a more expensive energy action is accepted. This can occur when an offshore wind farm provides frequency response, but more commonly occurs because a conventional plant has submitted low or negative prices to down to this SEL point. Clicking on this chart gives the full list of plants able to be turned down to SEL for the minute that has been clicked upon. Where there is a healthy margin of low cost bids to SEL the probability of a negative system price is reduced, but where the black section of this chart is very large, a negative system price becomes a high possibility.
Included DataThe data plotting in this chart is the difference between planned generation (FPN - Final Physical Notification) and the minimum generation at which a plant can operate before turning offline (SEL - Stable Export Limit). Values are ignored for Interconnectors, Nuclear and Wind Farms. Data ServiceThe data for the Bid to SEL Volumes Summary chart can be extracted from the API. The parameters are as follows:
|
||||||||||||||||||||||