|
Help Files:
|
Bid/Offer Prices
About
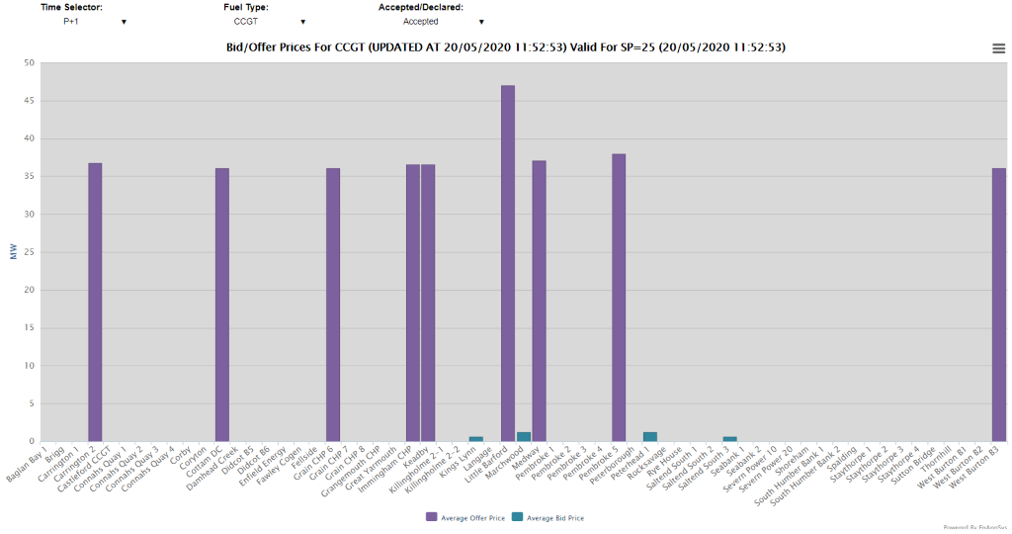
The Bid/Offer Prices chart can show the Offer and Bid Prices that apply in the market for a given time period. When set to LIVE, this shows the prices at which any units are being turned up or down in the live minute. When set by period, for instance P+1 it will show prices at all units seeing any balancing actions in the settlement period following the current period.
The data is grouped by fuel and can be filtered by “Fuel Type”. If no filter is set, it is possible to click on a column to see the same chart for all units of a given fuel type. Having done so, it is then possible to click on any column to see the balancing action at the given unit in more detail.
Included Data
The data on this chart is as follows:
- Average Offer Price - The average price of accepted/next declared/declared actions to increase generation via the Balancing Mechanism.
- Average Bid Price - The average price of accepted/next declared/declared actions to decrease generation via the Balancing Mechanism.
Data Service
The data for the Bid/Offer Prices chart can be extracted from the API. The parameters are as follows:
| Code |
Required/Optional |
Description |
| chart |
Required |
boprice |
| update |
Optional |
If false will always return data, else will return no
data message if no change since submitted time |
| gmtupdatetime |
Required if update=true |
If update=true must put in the time of the last update.
Can use the top field timestamp="2018-06-20T08:46:51" to get the
last check time and then this feature can be used to only get
data when a change has occurred. |
| format |
Required |
The type of format. The value could be xml or csv. (See 'formats' action)
|
| targettime |
Required |
The time selection (as in the URL on the matching
charts), e.g. live or 0 for current period or
-2 for current period minus 2 |
| accdecl |
Required |
Whether for accepted actions (0) or declared ones (1) |
| fuel |
Optional |
If not set (or equal to all) will show the summary values by fuel, else if set for
battery, biomass, ccgt, coal, hydro,
nuclear, ocgt, ps or wind this will show the values
for each of the units of the given fuel types. The tags are as in the URL once
an option has been picked on the chart view. |
|
Example :
enprompt.netareports.com/dataService?username=xxx&password=yyy&format=xml&action=data&chart=boprice&update=false&targettime=live&accdecl=0&fuel=all
|
|