|
Help Files:
|
NIV Analysis
About
The NIV Analysis chart is one of the most important charts in
the application:
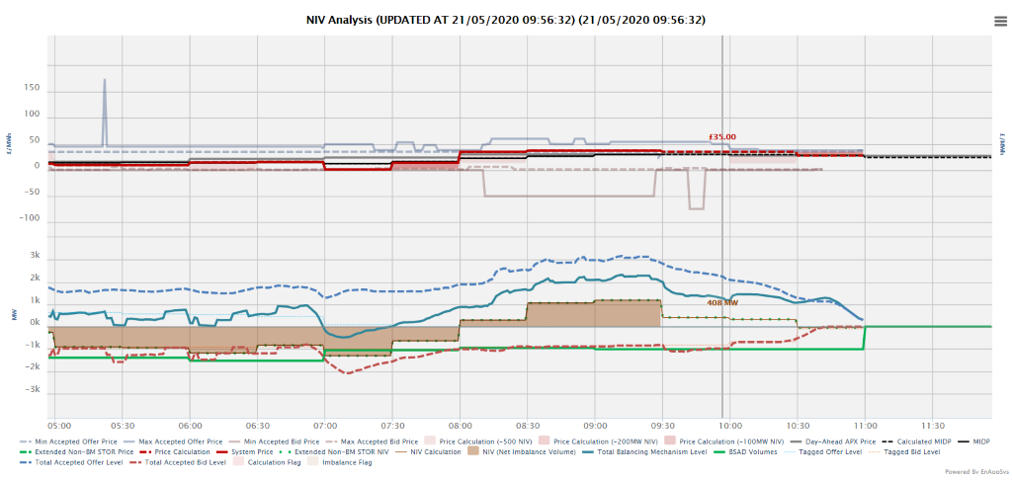
The second part of this chart shows the overall levels of
bids and offers in the market and shows how these relate to the Net
Imbalance Volume in the market over time. For instance in the above
chart, there were more offers than bids, but since 11am there have
been more bids than offers, with this looking set to continue for
the next few periods at least.
Then the top chart shows the current range of bid and offer
prices in the market along with a system price calculation. This
uses all the currently accepted actions to work out the current
system price, with a range showing how the price would change with
the addition of +/-100MW, +/-200MW and +/-500MW to give a
sensitivity analysis.
National Grid will often add actions late on one side, so
where there is a steep decline like in this case, it is more likely
that actions will be accepted nearer the time with the line
continuing on at around 1GW.
Included Data
The data on this chart is as follows:
- Min Accepted Offer Price - this is the lowest offer price that has been noted for each given point in time and so if an offer action to increase generation via the Balancing Mechanism sets the system price, then the system price will be at least this value.
- Max Accepted Offer Price - this is the highest offer price that has been noted for each given point in time and so if an offer action to increase generation via the Balancing Mechanism sets the system price, then the system price will be at most this value.
- Min Accepted Bid Price - this is the lowest bid price that has been noted for each given point in time and so if a bid action to decrease generation via the Balancing Mechanism sets the system price, then the system price will be at least this value.
- Max Accepted Bid Price - this is the highest bid price that has been noted for each given point in time and so if a bid action to decrease generation via the Balancing Mechanism sets the system price, then the system price will be at most this value.
- Price Calculation (+/-500MW) - this is a live calculation of the system price algorithm, but with the Net Imbalance Volume intersection point increased/decreased by 500MW to provide a sensitivity for a system price value for a large change in the net imbalance.
- Price Calculation (+/-200MW) - this is a live calculation of the system price algorithm, but with the Net Imbalance Volume intersection point increased/decreased by 200MW to provide a sensitivity for a system price value for a small change in the net imbalance.
- Price Calculation (+/-100MW) - this is a live calculation of the system price algorithm, but with the Net Imbalance Volume intersection point increased/decreased by 100MW to provide a sensitivity for a system price value for a very small change in the net imbalance.
- Day Ahead APX Price - the price for power in the 11am APX day ahead auction.
- Calculated MIDP - a live calculation of the current position of the the market index data price (the volume weighted average of the trades in the APX intraday auction within an 8 hour window ahead of delivery).
- MIDP - the market index data price (the volume weighted average of the trades in the APX intraday auction within an 8 hour window ahead of delivery).
- Price Calculation (Elexon Only) - Repeats the price calculation only using only BSAD data reported by Elexon. This should align with the reported System Price figures published and can be handy if there is BSAD data published by National Grid but not by Elexon which means the outturn system price will be incorrect and will get revised at a later date.
- Price Calculation (Minus ASDP Est) - Publishes the system price calculation based upon a blend of Elexon BSAD data and National Grid trades BSAD data.
- Price Calculation - a live calculation of the system price based upon the same algorithm used by Elexon after the period end to publish the outturn value. For BSAD data this version of the price forecast uses a blend of Elexon, National Grid trades and estimates for ASDP BSAD. The ASDP (Ancillary Service Dispatch Platform) is based upon reported non-BM STOR or Fast Reserve acceptances but with estimates having to be made for the probable duration. If these are used for a longer or shorter time than estimated then the level of BSAD calculated may be too low or high.
- System Price - the price at which over-produced power must be sold at and at which under-produced power must be bought at.
- NIV Calculation (Elexon Only) - a calculation of the Net Imbalance Volume but only using the BSAD data as reported by Elexon. This may mean some data is missing but should align with the reported outturn NIV values.
- NIV Calculation (Minus ASDP Est) - a calculation of the Net Imbalance Volume based upon a blend of Elexon BSAD data and National Grid trades BSAD data.
- NIV Calculation - a live calculation of the Net Imbalance Volume (NIV). For BSAD data this version of the price forecast uses a blend of Elexon, National Grid trades and estimates for ASDP BSAD. The ASDP (Ancillary Service Dispatch Platform) is based upon reported non-BM STOR or Fast Reserve acceptances but with estimates having to be made for the probable duration. If these are used for a longer or shorter time than estimated then the level of BSAD calculated may be too low or high.
- NIV (Net Imbalance Volume) - the difference between supply and demand in any given period.
- Total Balancing Mechanism Level - the sum of the offer volume and the bid volume plots to produce a net figure.
- BSAD Volumes (Elexon Only) - the BSAD data as reported by Elexon (actions taken by National Grid outside of the Balancing Mechanism)
- BSAD Volumes (Minus ASDP Est) - the BSAD data as reported by a blend of National Grid trades and Elexon data (actions taken by National Grid outside of the Balancing Mechanism)
- BSAD Volumes - the net volume of actions taken by National Grid outside of the Balancing Mechanism.
- Tagged Offer Level - the half-hourly volume of offer actions in a period which have been system tagged.
- Tagged Bid Level - the half-hourly volume of bid actions in a period which have been system tagged.
- Total Accepted Offer Level - the total accepted
offer volume is the total volume by which a unit has had its
levels of generation increased via the Balancing Mechanism.
- Total Accepted Bid Level - the total accepted bid
volume is the total volume by which a unit has had its levels of
generation decreased via the Balancing Mechanism.
Note that the traces for Extended Non-BM STOR Price and Extended Non-BM STOR NIV were removed when adding the extra traces for Price Calculation, NIV Calculationa nd BSAD Volumes as this estimate was superceded by these updates. Those values continue to be available on the API in case they are being used in models.
Data Service
The data for the NIV Analysis chart can be extracted from the API. The parameters are as follows:
| Code |
Required/Optional |
Description |
| chart |
Required |
pricingscreen |
| update |
Optional |
If false will always return data, else will return no
data message if no change since submitted time |
| gmtupdatetime |
Required if update=true |
If update=true must put in the time of the last update.
Can use the top field timestamp="2018-06-20T08:46:51" to get the
last check time and then this feature can be used to only get
data when a change has occurred. |
| format |
Required |
The type of format. The value could be xml or csv. (See 'formats' action)
|
|
Example :
enprompt.netareports.com/dataService?username=xxx&password=yyy&format=xml&action=data&chart=pricingscreen&update=false
|
|