Frequency
About
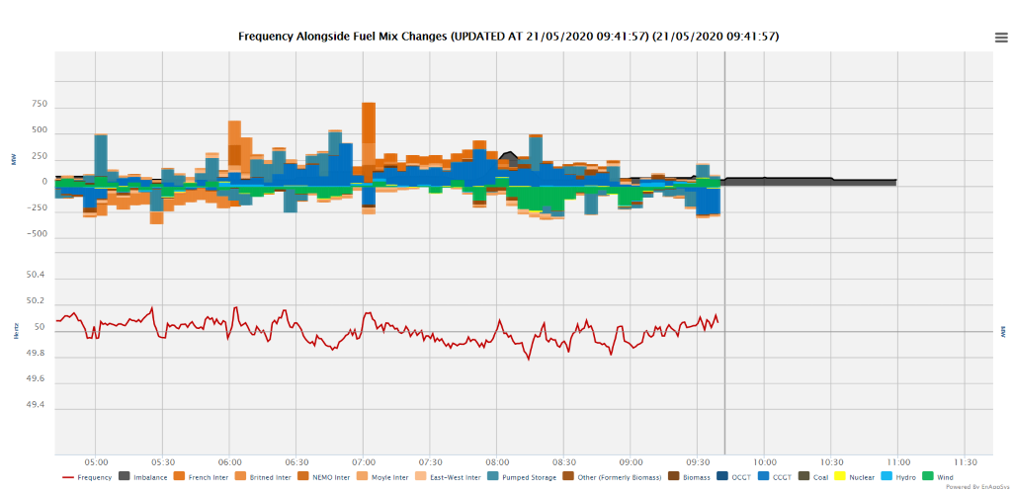
The Frequency charts gives an alternative view of the market that can be used to show what the 5 minutes to 5 minutes changes in output by fuel type have been over the past few hours and how this relates to frequency. The chart has been setup to show frequency activity in the range between 49.5Hz and 50.5Hz ensuring that the magnitude of any frequency deviations can be quickly identified at a glance.
Clicking on the columns or on the imbalance area will open a box that shows the imbalance volumes and will give more information on the units creating the changes. Once this box is opened it is possible to click through from here to see more information about a given unit.
Included Data
The fuel mix data is the 5 minute fuel mix values published by National Grid which derive from operational metering.
The Frequency data is also published by National Grid and these values change based upon the changing levels of supply/demand in the market.
If demand is greater than generation then frequency levels will fall, and this happens most commonly when a plant has an issue and suddenly stops delivering it's normal output levels. Where generation exceed demand the frequency will climb.
The overall limits for frequency management are set at 50.5Hz and 49.5Hz, with National Grid having a statutory obligation to keep the frequency within these limits with a tolerance of 60 second in extreme situations. The normal operating ranges however, are between 49.8Hz and 50.2Hz and these are the points at which frequency deviations will see the largest correction back to normal operating levels.
Large changes in interconnector output can be a common source of frequency deviations.
Data Service
The data for the Frequency chart can be extracted from the API. The parameters are as follows:
| Code |
Required/Optional |
Description |
| chart |
Required |
freq |
| update |
Optional |
If false will always return data, else will return no
data message if no change since submitted time |
| gmtupdatetime |
Required if update=true |
If update=true must put in the time of the last update.
Can use the top field timestamp="2018-06-20T08:46:51" to get the
last check time and then this feature can be used to only get
data when a change has occurred. |
| format |
Required |
The type of format. The value could be xml or csv. (See 'formats' action)
|
|
Example :
enprompt.netareports.com/dataService?username=xxx&password=yyy&format=xml&action=data&chart=freq&update=false
|
|