|
Help Files:
|
Interconnector Flows
About
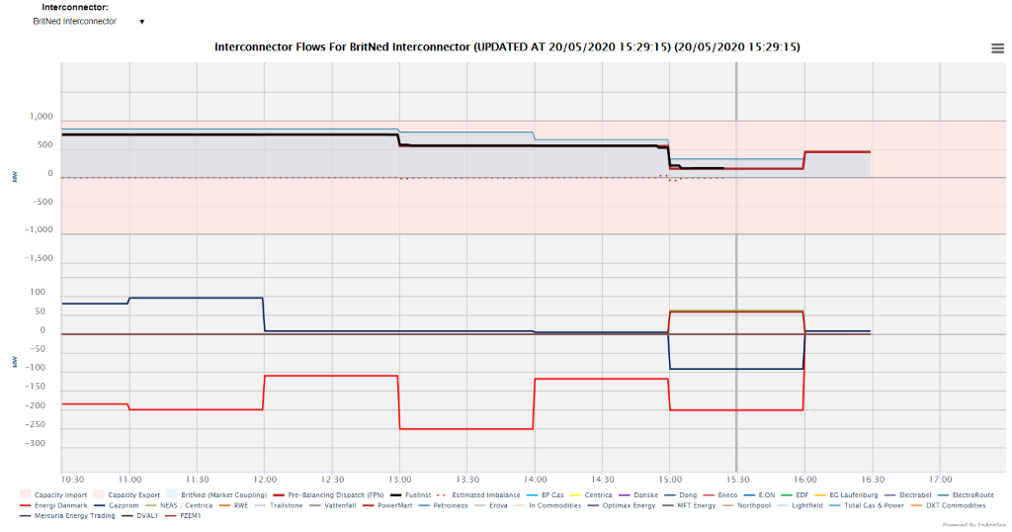
The Interconnector Flows chart provides a live view on the activity of the different market parties along a given interconnector. This data is available from the main database historically, but this shows how parties have been trading the market and how this has contributed to the planned levels of import/export along an interconnector.

This data is available from the main database historically,
but this shows how parties have been trading the market and how
this has contributed to the planned levels of import/export along
an interconnector.
Included Data
The data plotted for each market party is the FPN (Final Physical Notification) data that has been submitted, with the Market Coupling party split out and shown as an area to make clear the adjustments made within day.
Estimated Imbalance values are also shown on this chart. This calculation is looking at the difference between the sum of the FPN planned import/export profiles and the metered fuel mix data for each interconnector (published via the FuelInst plot).
Data Service
The data for the Interconnector Flows chart can be extracted from the API. The parameters are as follows:
| Code |
Required/Optional |
Description |
| chart |
Required |
interflows |
| update |
Optional |
If false will always return data, else will return no
data message if no change since submitted time |
| gmtupdatetime |
Required if update=true |
If update=true must put in the time of the last update.
Can use the top field timestamp="2018-06-20T08:46:51" to get the
last check time and then this feature can be used to only get
data when a change has occurred. |
| format |
Required |
The type of format. The value could be xml or csv. (See 'formats' action)
|
| inter |
Required |
The interconnector to plot for (look at URL from charts
to pair ids with interconnectors). IDs are 0 (BritNed),
1 (East-West), 2 (French), 3 (Moyle),
4 (Nemo), 5 (IFA2), 6 (NSL), 7 (Eleclink)
and 8 (Viking). |
|
Example :
enprompt.netareports.com/dataService?username=xxx&password=yyy&format=xml&action=data&chart=interflows&update=false&inter=0
|
|