|
Help Files:
|
Generation & Availability
About
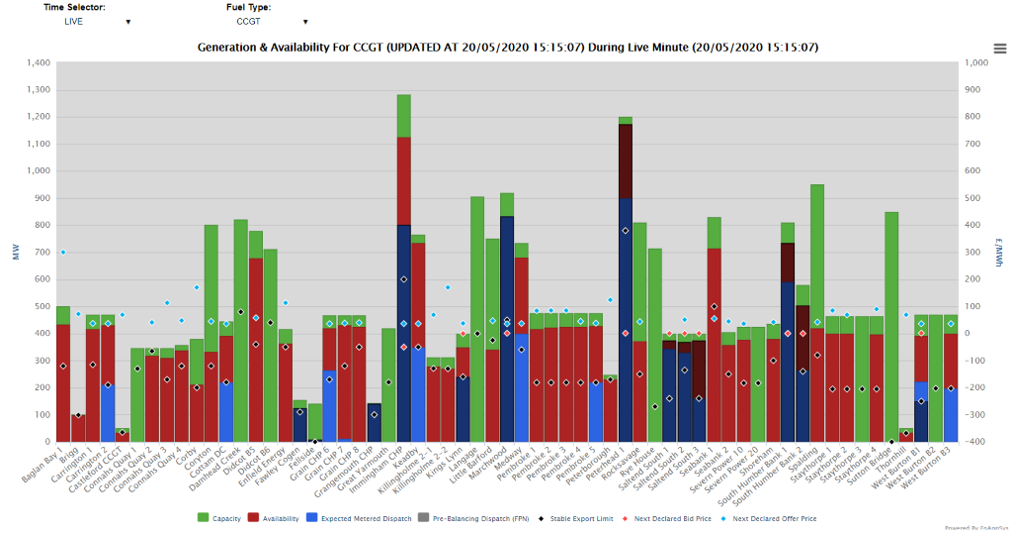
The Generation & Availability chart can provide an overview of the whole market or of a particular fleet. This chart can be used to get a view of what unit can turn up or down in the market and the Stable Export Limit supports this analysis. The next available Bid and Offer Prices are also shown so that it is possible to determine if increases or decreases in output are financially viable.
Included Data
The data on this chart is as follows:
- Capacity - The nameplate capacity of the unit - ie if at 100% availability.
- Availability - Levels of real
time availability as noted by Max Export Limit availability data
(the maximum level at which the BM Unit may be exporting to the
GB Transmission System at the Grid Supply Point), with units having an obligation to re-declare
their Max Export Limit (MEL) whenever their availability reduces
(for instance after a failed start). Where MEL is below expected
metered volume a unit has an indicated imbalance.
- Expected Metered Dispatch - The levels of post-balancing generation after National Grid has adjusted generation
within gate closure.
- Pre-Balancing Dispatch (FPN) - The levels of planned generation ahead of gate closure and typically matching
the volumes sold in traded markets.
- Stable Export Limit - The minimum stable export operating level for BM Unit, ie the point below
which a unit cannot go without turning off.
- Next Declared Bid Price - The next declared bid price is the
next valid price at which a unit can have its levels of generation
decreased via the Balancing Mechanism.
- Next Declared Offer Price - The next declared offer price is
the next valid price at which a unit can have its levels of generation
increased via the Balancing Mechanism.
This provides an overview of the fleet that shows in green
the overall capacity of a unit and in red the levels of
availability. Where a column is only green a unit is offline and
where it is only red it is available, but not generating.
The current generation levels are shown in blue, but with a
dark transparent column showing the planned levels of generation.
This means that the blue will only be visible for any volumes that
correspond to offer volumes and will be transparent black for any
bid volumes.
This chart can be used to get a view of who can turn up or
down in the market and the Stable Export Limit supports this
analysis. The next available Bid and Offer Prices are also shown so
that it is possible to determine if increases or decreases in
output are financially viable.
Data Service
The data for the Generation & Availability chart can be extracted from the API. The parameters are as follows:
| Code |
Required/Optional |
Description |
| chart |
Required |
gaa |
| update |
Optional |
If false will always return data, else will return no
data message if no change since submitted time |
| gmtupdatetime |
Required if update=true |
If update=true must put in the time of the last update.
Can use the top field timestamp="2018-06-20T08:46:51" to get the
last check time and then this feature can be used to only get
data when a change has occurred. |
| format |
Required |
The type of format. The value could be xml or csv. (See 'formats' action)
|
| targettime |
Required |
The time selection (as in the URL on the matching
charts), e.g. live or 0 for current period or
-2 for current period minus 2 |
| fuel |
Optional |
If not set (or equal to all) will show the summary values by fuel, else if set for
battery, biomass, ccgt, coal, hydro,
nuclear, ocgt, ps or wind this will show the values
for each of the units of the given fuel types. The tags are as in the URL once
an option has been picked on the chart view. |
|
Example :
enprompt.netareports.com/dataService?username=xxx&password=yyy&format=xml&action=data&chart=gaa&update=false&targettime=live&fuel=all
|
|