|
Help Files:
|
Imbalance (Trip) Summary
About
The Imbalance (Trip) Summary gives an overview of all the plants which are struggling to meet their planned levels of generation in the market. This is shown by fuel type but clicking on this chart will show the units that have suffered issues during any given minute. This is most useful in seeing any large changes.
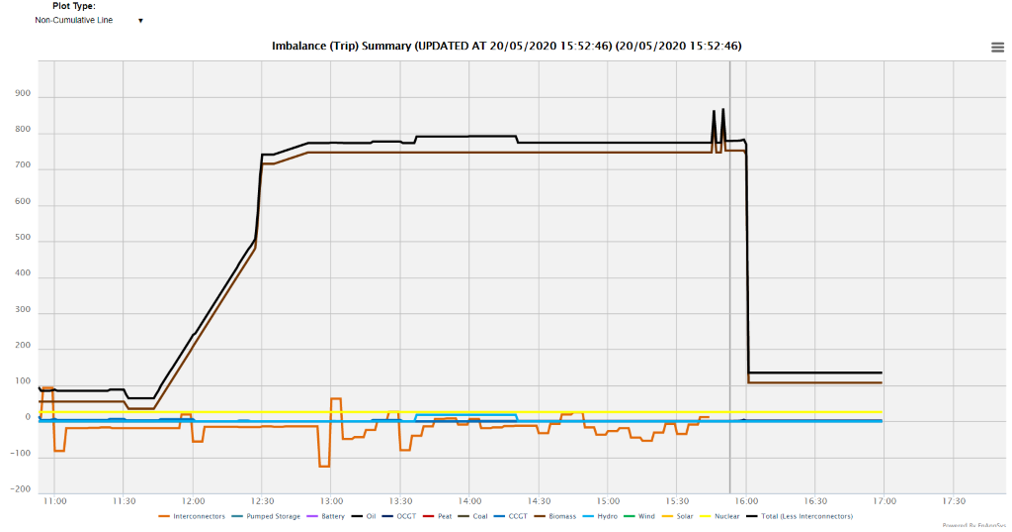
In the above chart, Biomass has struggled the most to meet their planned levels of generation.
Included Data
The imbalance volume is calculated as the maximum of zero and the generation subtracting the availability, ie the levels of generation that cannot be achieved because of insufficient availability.
The availability figure used is the Max Export Limit availability data
(the maximum level at which the BM Unit may be exporting to the
GB Transmission System at the Grid Supply Point), with units having an obligation to re-declare
their Max Export Limit (MEL) whenever their availability reduces
(for instance after a failed start).
The generation figure used is the levels of post-balancing generation after National Grid has adjusted generation
within gate closure.
This does not apply for interconnectors where an estimate of imbalances is taken historically by comparing the planned import/export from FPN data (pre-gate closure generation figures by party summed up by interconnector) to the fuel mix metered data by interconnector. These imbalances exist around the half-hourly changes in flows and in cases where FPN data is not published as it should be or if the metered volume is not what it should be. In both cases this will change the Net Imbalance Volume from the expected levels.
Data Service
The data for the Imbalances chart can be extracted from the API. The parameters are as follows:
| Code |
Required/Optional |
Description |
| chart |
Required |
imbal |
| update |
Optional |
If false will always return data, else will return no
data message if no change since submitted time |
| gmtupdatetime |
Required if update=true |
If update=true must put in the time of the last update.
Can use the top field timestamp="2018-06-20T08:46:51" to get the
last check time and then this feature can be used to only get
data when a change has occurred. |
| format |
Required |
The type of format. The value could be xml or csv. (See 'formats' action)
|
| targettime |
Required |
The time selection (as in the URL on the matching
charts), e.g. live or 0 for current period or
-2 for current period minus 2 |
| fuel |
Optional |
If not set (or equal to all) will show the summary values by fuel, else if set for
battery, biomass, ccgt, coal, hydro,
nuclear, ocgt, ps or wind this will show the values
for each of the units of the given fuel types. The tags are as in the URL once
an option has been picked on the chart view. |
|
Example :
enprompt.netareports.com/dataService?username=xxx&password=yyy&format=xml&action=data&chart=imbal&update=false&targettime=live&fuel=all
|
|