Imbalances
About
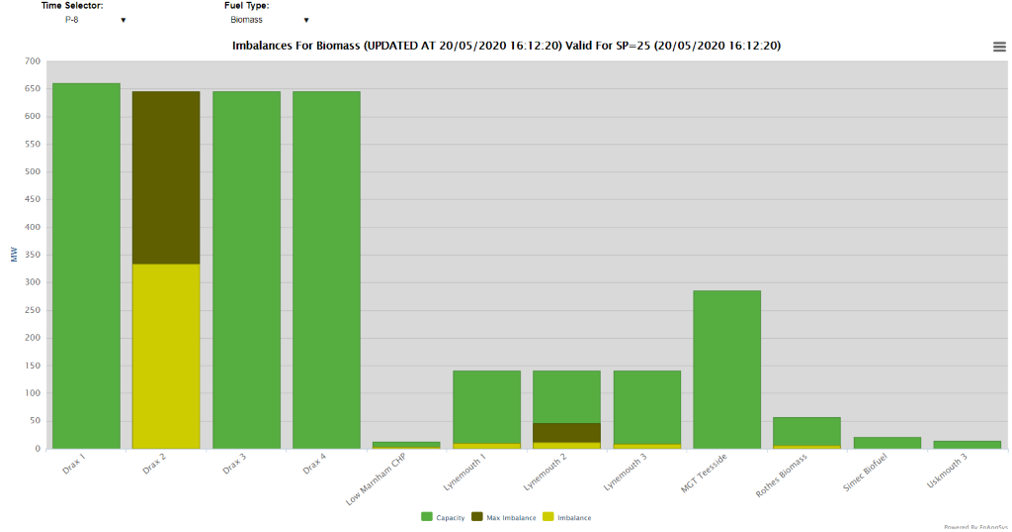
The imbalances chart shows indicated levels of imbalances either by unit or across a fuel type showing both average and maximum levels of imbalances. It is worth noting that this chart can also show imbalances over the past hour and forwards an hour using the time selection menu.
The maximum imbalance series will show the worst imbalance that occurred. The typical use of this chart would be to see which units are imbalancing, for instance by seeing which CCGT and coal units have seen large imbalances over the past hour or expected over the next hour.
When looking at imbalances across a filter a series can be clicked on to drilldown into that filter (e.g. Biomass) which shows the single units. If a single unit is clicked on the user has the option to visit the BM Unit Operations chart for the period and see the operational data to find out more about any imbalances that have occurred.
Included Data
The data on this chart is as follows:
- Capacity - The nameplate capacity of the unit - ie if at 100% availability.
- Max Imbalance - The highest imbalance level that occurred in the period.
- Imbalance - The average level of imbalance in the period (being reduced by zero values when imbalances were not occurring).
The imbalance volume is calculated as the maximum of zero and the generation subtracting the availability, ie the levels of generation that cannot be achieved because of insufficient availability.
The availability figure used is the Max Export Limit availability data
(the maximum level at which the BM Unit may be exporting to the
GB Transmission System at the Grid Supply Point), with units having an obligation to re-declare
their Max Export Limit (MEL) whenever their availability reduces
(for instance after a failed start).
The generation figure used is the levels of post-balancing generation after National Grid has adjusted generation
within gate closure.
Data Service
The data for the Imbalance (Trip) Table table can be extracted from the API. The parameters are as follows:
| Code |
Required/Optional |
Description |
| chart |
Required |
triptable
|
| format |
Required |
The type of format. The value could be xml or csv. (See 'formats' action)
|
| targettime |
Required |
The time selection (as in the URL on the matching
charts), e.g. live or 0 to be current
period or -2 to be current period minus two |
|
Example :
enprompt.netareports.com/dataService?username=xxx&password=yyy&format=xml&action=data&chart=triptable&targettime=live
|
|