Bid/Offer Profile
About
The Bid/Offer Profile chart provides a visual view of a single unit’s bidding approach in the Balancing Mechanism in one screen. The unit can have any offer actions accepted within the blue area and any bid actions accepted within the offer area, with prices running along the horizontal axis.
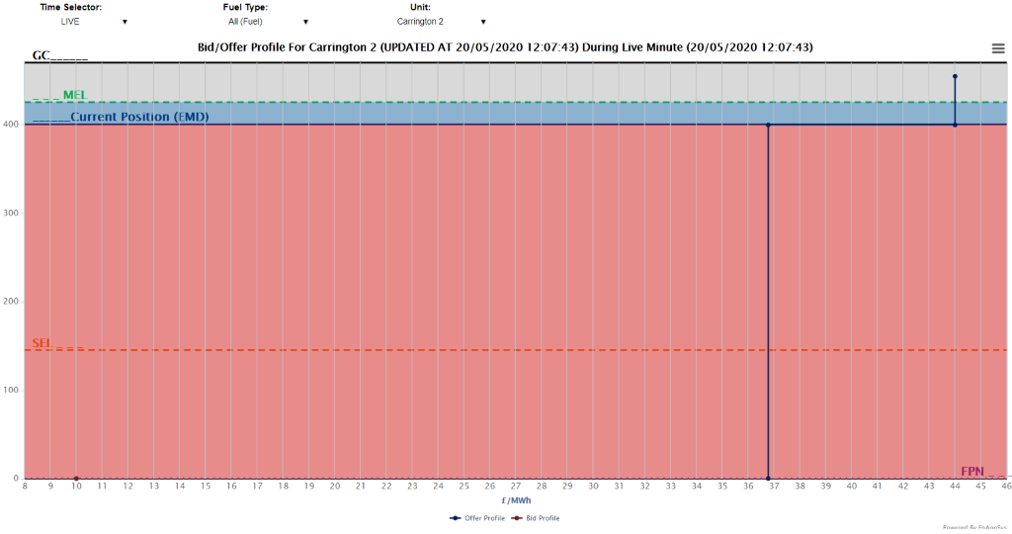
In the above example, Carrington 2 wasn’t planning to and declared an FPN position of 0MW. It has so far been turned up to around 400MW, to the point where the price of turning up Carrington 2 increases from £37/MWh to £44/MWh. The unit has been turned up above its SEL so could be turned back down if required.
National Grid cannot turn a plant down beyond its SEL (Stable Export Limit) without turning it off and for any further MWh reductions after this SEL point (to zero) the price normally more costly.
Since for a bid action to reduce generation, the price is the price paid from the generator to National Grid (with the generator having already sold the power for a higher fee), lower prices are more expensive for National Grid and so turning a plant offline can be very costly.
Data Service
There is no data service for this chart.
|